A preliminary study into feeding rates of the Black-lipped Pearl Oyster Pinctada margaritifera
Within commercial hatcheries, microalgae is predominantly used as a food source due to its high nutritional value, and so studies into the specific nutritional value of individual microalgal species has been well reviewed (Muller-Feuga et al, 2006). Much of this research, however has been focused on the feeding requirements of primarily hatchery and juvenile stock, as it is during these stages that the pearl oysters are still kept within hatcheries and thus require feed. Once juveniles are large enough, they are transferred to various rearing containers or cages and placed into the sea. Growth rates during this time differ between species and locations (Hwang et al. 2007). The rates of feeding during this time may contribute to the growth rates.
A preliminary investigation into the feeding rates of adult black-lipped pearl oysters Pinctada maragritifera was thus conducted under lab-aquaria conditions. in order to better understand this.
*Initially a variety of seaweed species were collected, weighed to 300g and then blended with 3 liters of water to be used as the feeding solution. The hope within this primary methodology was to use the colour changes of the water over time as a measure of feeding rate. It was presumed that as the pearl oysters fed upon the algae within the water, it would become clearer.
This method was abandoned after 24 hours of no colour change. It also appeared that the oysters remained closed for at least the last 12 hours. It is not clear as to why this was, but it was assumed that the algal particles were 1. either too large, 2. there was initially too much algae within the water to notice minor changes, 3. that the water turbidity restricted their capacity to take in oxygen or 4. that the amount of algae present was causing a hypoxic environment due to their photosynthetic mechanisms.
Methods
Three tanks of equal size and approximately 80 liters were used. They were then all filled equally with salt water. Each tank was fitted with a water aeration pump and a thermometer. The six pearl oysters that were used were initially weighed and the results noted (fig1). Three oysters were used per treatment session. The first session ran for a total of 19 hours, and the second for a total of 8 hours. Water samples were taken from each tank before algae was introduced. Each tank received 3.5ml of Shellfish Diet 180, which is made up of marine microalgae. Water samples were again then taken from each tank prior to introduction of oysters. The oysters were then monitored every 2 hours. At this time, a water sample was taken from each tank, the temperature was recorded and a note was made of whether the shells were open or closed. The water samples were then measured using a mass spectrometer to determine the amount of algae particles present within each water sample.
| |
Oyster no.
|
Weight (g)
|
|
|
1
|
249.55
|
|
|
2
|
274.41
|
|
|
3
|
740.51
|
|
|
4
|
177.43
|
|
|
5
|
224.51
|
|
|
6
|
147.01
|
|
Results and Discussion
Sea water, with no added algae was standardized for a 100% spectrometer reading. Thus, it was expected that as the oysters fed, the spectrometer reading would decrease. This however, was not the case as can be seen where a fluctuation, and in some areas an increase above 100% occurs (fig 2). Our results were therefore inconclusive. We believe this to be due to the mass spectrometer being unable to adequately calculate the mass for such fine algae particles. We attempted recalibrating it at different wavelengths, however this made little difference. Another possible reason for such season may be due to added algal growth during the time period in which the study took place.
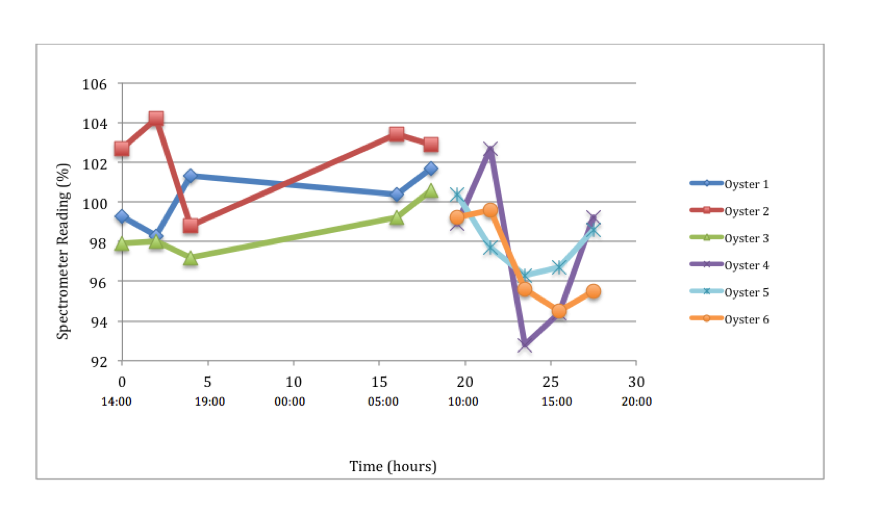 Figure 2: Feeding rate as a spectrometer percentage of Pinctada margaritifera over time Figure 2: Feeding rate as a spectrometer percentage of Pinctada margaritifera over time
Images
|